Innovationgame
Reprinted from TEC 50 Issue 3 (March 2009)
L D HOWE
National Traffic Control Centre (NTCC), 3 Ridgeway, Quinton Business Park, Quinton Parkway, Birmingham, B32 1AF
PACS Numbers: 02.70.Lq, 02.70.Rw, 46.90.+s, 89.40.+k
Key Words: traffic, highway, simulation, modelling
The Highways Agency has installed a system to display travel times on variable message sites along the motorway and trunk road network, thereby providing automated information to drivers. It does this by using current and historic journey times derived from automatic number plate recognition cameras. With the present system, during delay events, there are limitations to the achievable accuracy of the predictions. EDDEE uses traffic flow data from a pair of monitoring sites, one upstream and one downstream, to calculate the number of vehicles between them and the time taken to traverse the intervening carriageway. It was originally developed using historical data from the A34 Northbound between the M4 and the M40 for a three-month period in order to explore the feasibility of implementing EDDEE on a real-time basis. The first practical implementation will be a prototype in the form of a web-based display in the NTCC control room. In its final form, EDDEE is expected to be integrated fully into the NTCC system. Control room operators will be able to use it as part of their normal operational console. The output should also be available for incorporation into the Traffic England website. The intention is to give maximum visibility of accurate, up-to-date information to the travelling public.
EDDEE stands for Event Detection and Delay Estimation Engine. The EDDEE project is based on theoretical work reported previously in TEC [1]. The Highways Agency has installed a system to display travel times on variable message sites (TTVMS) along the motorway and trunk road network, providing automated information to drivers [2]. TTVMS uses current and historic journey times derived from automatic number plate recognition (ANPR) cameras. The current version of TTVMS works well when traffic conditions are fairly close to normal, but when there are severe delays or when an incident occurs resulting in an rapidly increasing delay, the predictions become unreliable.
EDDEE, on the other hand, uses traffic flow data from a pair of monitoring sites, one upstream and one downstream, to calculate the number of vehicles between them and the time taken to traverse the intervening carriageway. Each monitoring site comprises a pair of induction loops per lane, which are buried in the road and count the vehicles that pass over them. In addition they detect vehicle speed, length and carriageway occupancy (the percentage of the road covered by vehicles). The advantage of this is that if the outflow suddenly decreases or the inflow suddenly increases, the effect is detected very quickly and the predictions remain reliable. Conversely, at the end of an event, the increase in outflow or decrease in inflow will be detected, signalling the end of the event. Note that it is impossible to predict the future in terms of how long it will be before the ratio of inflow to outflow will change, either favourably or adversely. Such changes are generally caused by the intervention of traffic officers who may open or close lanes, depending on the specific conditions prevailing at the time. However, when such changes are made, EDDEE will immediately adjust the delay prediction to match the current status of the traffic flows.
The National Traffic Control Centre (NTCC) is run by Serco on behalf of the Highways Agency (HA). It monitors the project network (the motorways and "A" roads under the jurisdiction of the HA) and collects traffic data for calculating delays in two principal ways.
The VEDENS [3] traffic flow simulation was used to establish the theoretical basis for EDDEE, as reported in reference [1].
The development of EDDEE has been a gradual process. The initial concept was tested using the VEDENS [3] model and reported in TEC [1]. The next stage was to develop a method of using historical data from existing monitoring sites to explore the feasibility of implementing EDDEE on a real-time basis. In this case, data was used from the A34 Northbound between the M4 and the M40 for a three-month period commencing 11 September 2006. To achieve the desired results, the road was divided up into 9 sectors, with a monitoring site at the upstream and downstream end of each sector (all but the first and last monitoring sites were used as both the downstream site for the preceding sector and the upstream site for the following sector). The output was the calculated delay for each sector. An example is shown in Figure 1.
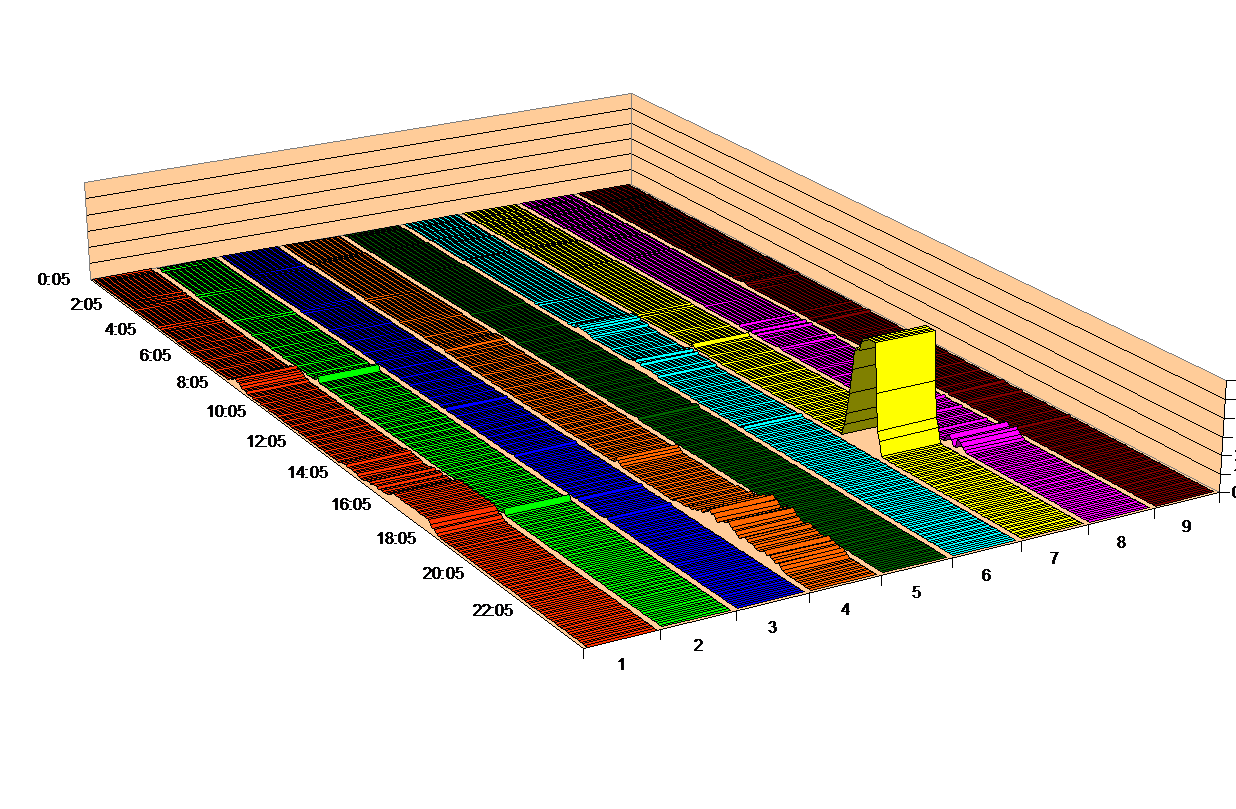
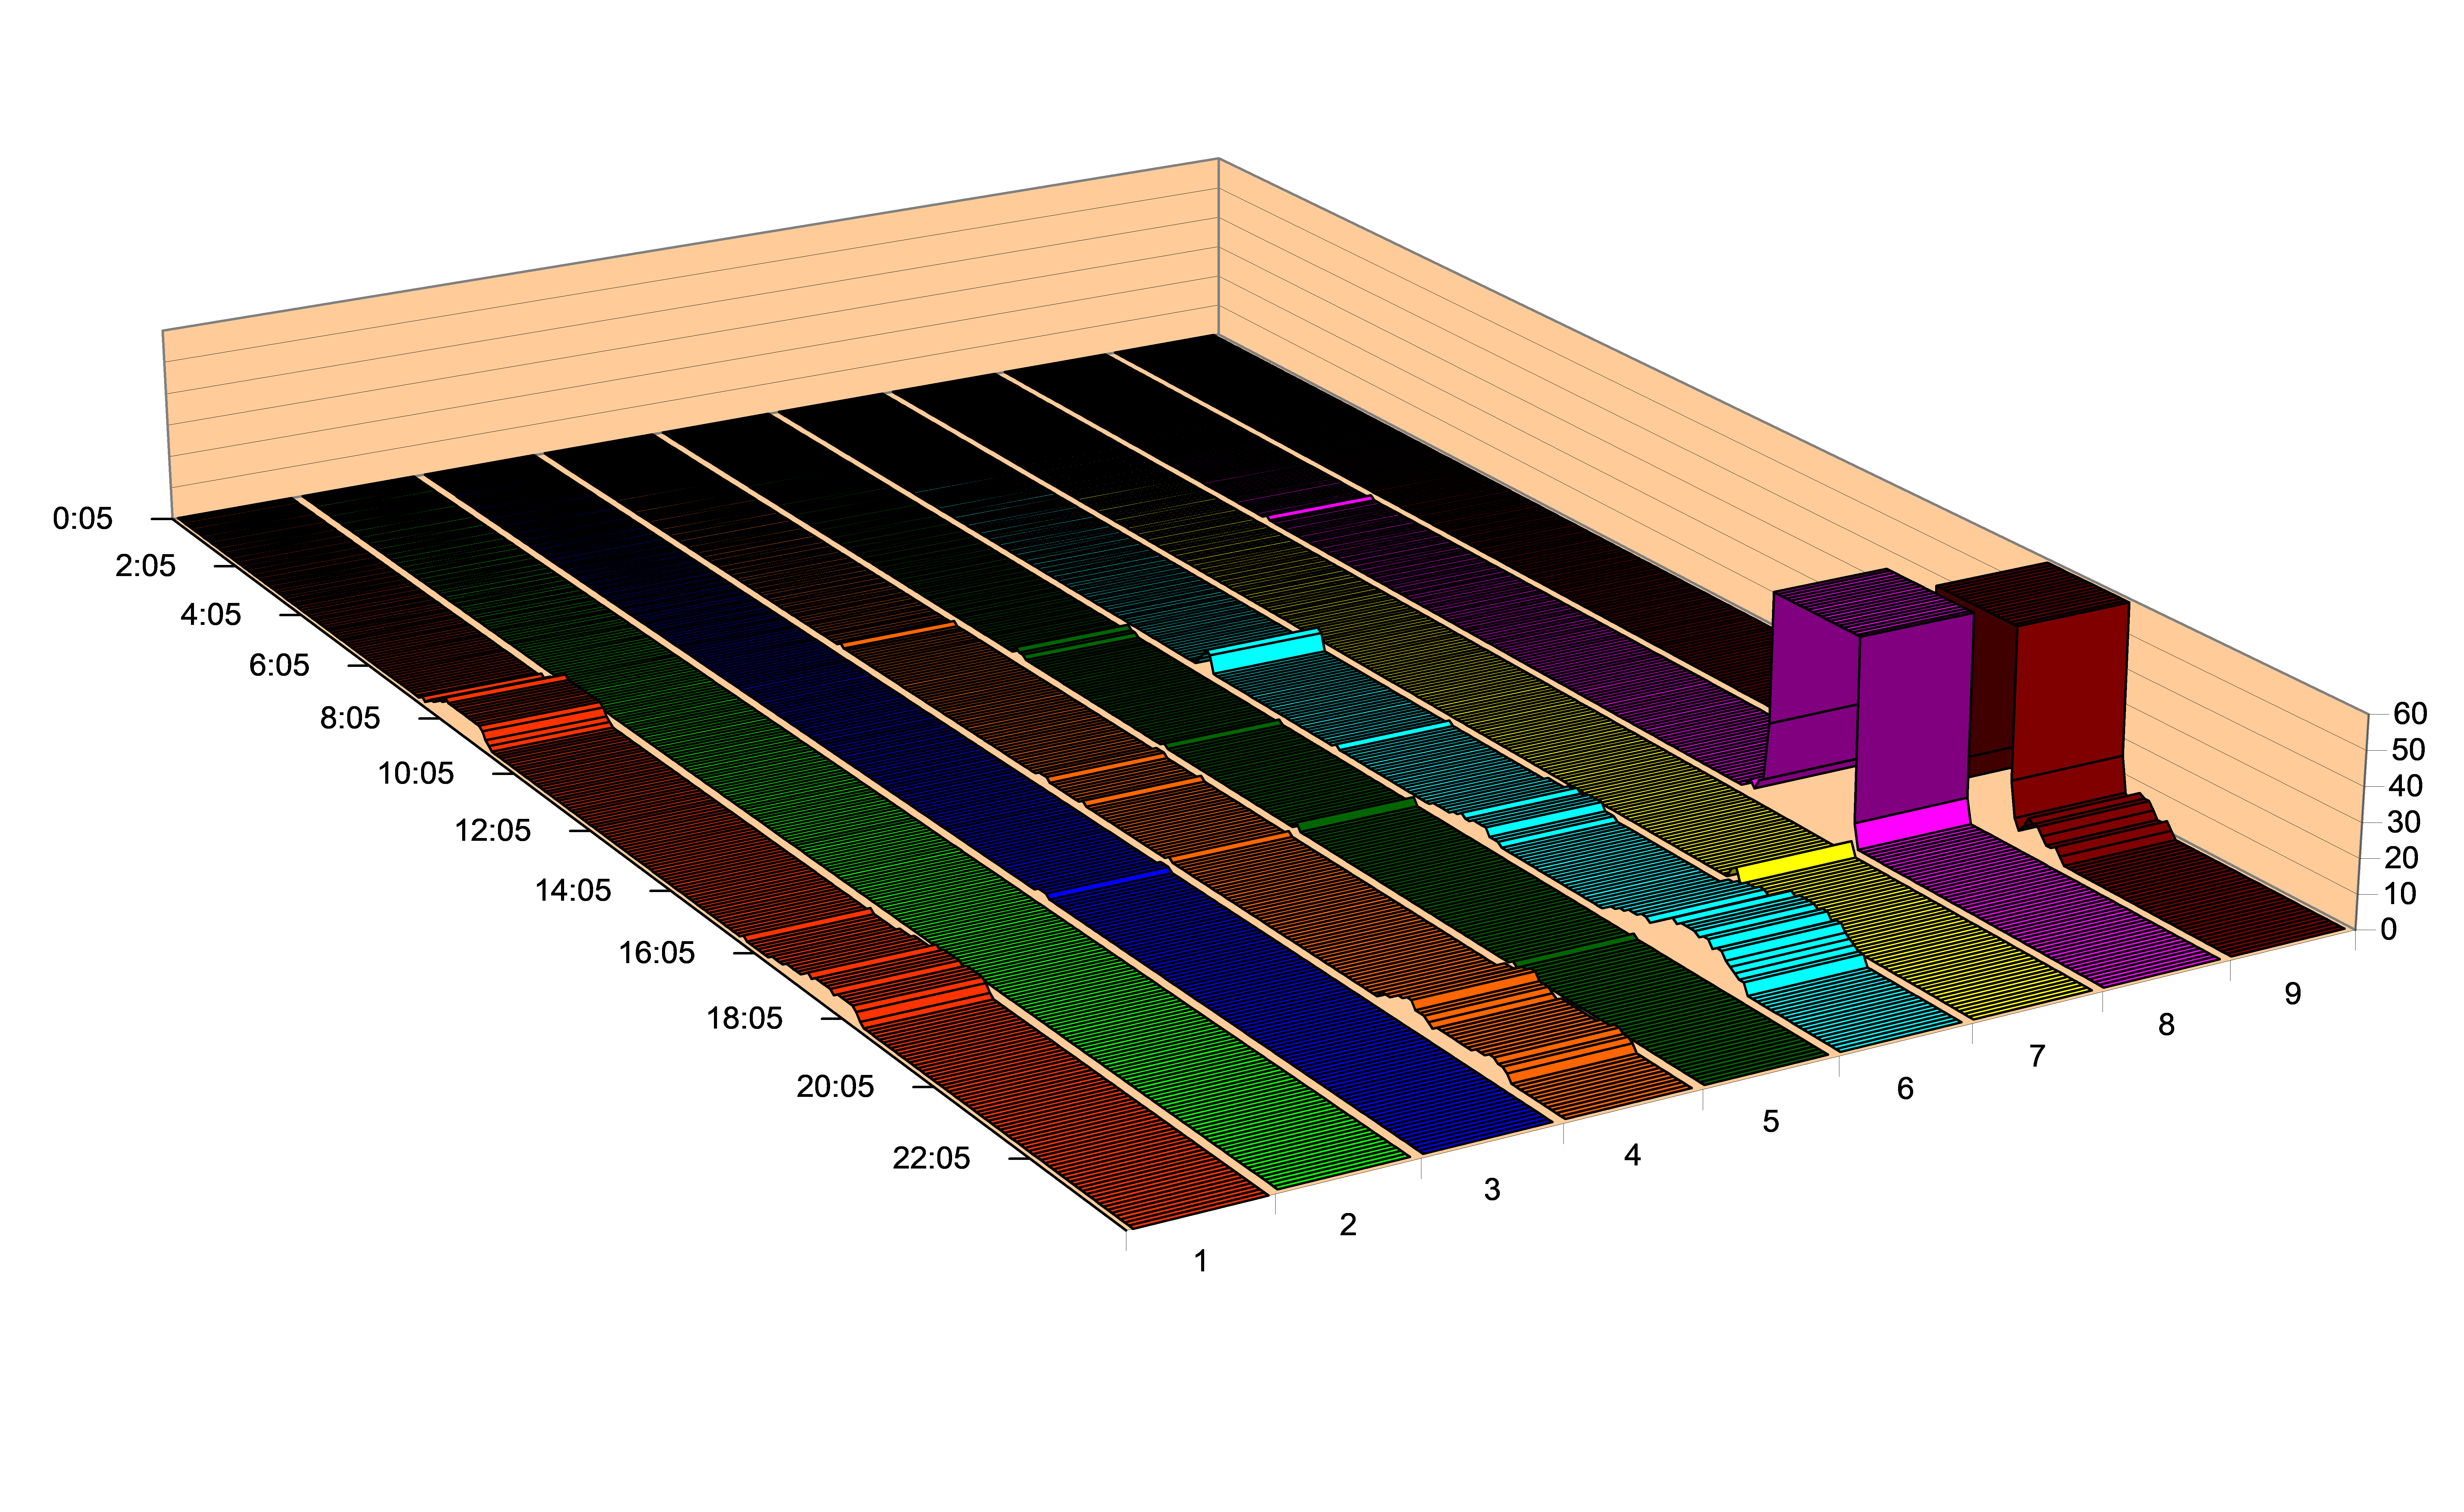
The graph shows small delays in most sectors, the most notable of which is the queue for the M40 roundabout in Sector 1. The most significant feature of the graph is an event in Sector 7 at around 1800 hrs. By the time the cause of the delay was removed, the queue had built back to the end of Sector 8, where it created a small delay for traffic waiting to move into Sector 7. An even more dramatic event is shown in Figure 2, where there was clearly a closure (the delay in the diagram has been capped at one hour).
Currently, EDDEE is being developed to use live data for the A34 delay segment (a delay segment is defined as a logical sequence of sectors for the purpose of calculating delays). An example of the division of part of the project network into 3 delay segments is:
The first stage in the current development is to load the historical data into a copy of the live database. This will enable the project team to check that data extraction process produces identical results to those from the historical data phase. Thereafter, current data from the live database will be used. The development of EDDEE will then be extended, delay segment by delay segment, to encompass the entire project network. Concurrently, the development of the output data streams will take place to ensure the most useful data format for use by the control room and other system users.
The first practical implementation will be a prototype in the form of a web-based display in the NTCC control room. The display will include the following information:
The operational part of the EDDEE prototype comprises three parts:
The database application extracts all the required data from the NTCC database in a few seconds. The FORTRAN application takes about 20 seconds to carry out all calculations for the entire project network and write the output into a file for use by the web-based application. In addition, there is a set-up part of EDDEE to define and re-define the delay segments, sectors and monitoring sites. The latter is required each time the model of the project network changes.
Once the first prototype has been accepted, the planning stage for the full implementation will begin. This will include testing new ideas on the prototype to improve the performance and usability of EDDEE. In its final form EDDEE is expected to be integrated fully into the NTCC system. This means that the control room operators will be able to use it as part of their normal operational console. The output should also be available for incorporation into the Traffic England website. Finally, other data feeds to external organisations and users will be implemented, giving maximum visibility of the EDDEE output to the travelling public.
EDDEE has four times the granularity of journey time data. It is therefore much easier to pinpoint an event at its onset. It is not possible to achieve the same granularity with ANPR because the shorter the section, the more difficult it becomes to detect a delay. Also, because relative traffic flow rates change immediately at the onset of the event, the detection of events by EDDEE is more rapid and more reliable than that derived from journey time information. Indeed, in the event of a closure, journey times cease to be generated, so no delay is created and no automatic event detection is possible. Even where there is no closure, the full effect of a delay is not apparent until the delay has propagated to the downstream ANPR camera site.
Delays detected by EDDEE are those that will be experienced by a driver passing the upstream monitoring site. They therefore represent an up-to-date prediction for all road users. On the other hand, journey time data represents the times experienced by drivers passing the downstream site and are not representative of the delay that will be experienced by drivers currently entering the delay event. In order to overcome this, TTVMS compares the travel time with historical travel times and makes a forward projection as to the time that will be experienced by drivers at the upstream site.
When delay events end, EDDEE will immediately detect the release of traffic from the queue (or the reduction in traffic joining the queue). As the delays decrease, EDDEE will automatically calculate the correct delay for those vehicles entering the queue. Once the delay has disappeared, EDDEE will indicate the final end of the event. Conversely, the measured journey time includes all the time spent in the queue, so when vehicles are released from a queue, the release cannot be detected until some time afterwards.
When TTVMS predicts travel times that deviate too far from historical travel times, the automatic calculation of travel times ceases and the control room operators are expected to use their judgement to make an estimate of the delay. Such estimates are notoriously difficult to make accurately, especially when the delay time is changing rapidly. EDDEE will allow TTVMS to operate normally until an event is detected. Thereafter, it will take control of the delay prediction. It will only relinquish control when the TTVMS travel time returns to a value that is consistent with historical travel times.
[1] L D Howe Estimating Traffic Delays from Loop-Based Traffic Flow Monitors TEC 47 No 7 (July 2006)
[1] Working on the Next Big Idea TEC 48 No 10 (November 2007)
[1] L D Howe Studies of Traffic Flow Phenomena Using the VEDENS Computer Code Physica A 246 (1997)

 Download a PDF version of this paper