Innovationgame
Reprinted from TEC 50 Issue 3 (MARCH 2009)
Philip Tait
National Traffic Control Centre (NTCC), 3 Ridgeway, Quinton Business Park, Quinton Parkway, Birmingham, B32 1AF
PACS Numbers: 02.70.Lq, 02.70.Rw, 46.90.+s, 89.40.+k
Key Words: traffic, highway, simulation, modelling
The National Traffic Control Centre (NTCC) collects traffic data in real time. Data received from the Traffic Monitoring Equipment are processed to calculate vehicle flow rates. The accuracy of these flow rates is determined using a self-monitoring validation methodology. This paper describes the application of the Long-term Improvement Process (LIP) to develop CAVEMAN which is now recognised as the approved methodology for validating the accuracy of vehicle flow data on the Highway's Agency Project Network.
The Highways Agency's Project Network consists of the motorways and major trunk roads in England. The network is represented by a traffic data model containing approximately 12,000 links of which 4070 are currently designated as strategically important and contain reporting points. The National Traffic Control Centre (NTCC) is run by Serco on behalf of the HA and is responsible for maintaining the traffic data model; collecting and processing real time data from Automatic Number plate Recognition systems (ANPR) and Traffic Monitoring Equipment (TME) and ensuring that traffic data is reported accurately. The NTCC system calculates flows as vehicles per hour every five minutes for each reporting point. These flows are derived from traffic counts received from TME inductance loops located on major carriageways within the network. Approximately 30% of reporting point links have no installed monitoring equipment and the flow rates have to be derived using traffic counts from more than one location. In all cases, the accuracy of the flows must be validated and are subject to a contractual reporting process on a monthly basis.
Traditionally, the only way to check the accuracy of flow data has been to make a video recording of the traffic and manually count the vehicles passing a reporting point. The counts are then compared with the flow data so that the accuracy of the data can be assessed. However, checking the accuracy of all the reporting points in this way would take a very long time and, given that the majority of data are accurate, would be extremely inefficient. To satisfy contractual requirements to demonstrate accuracy of flow data, NTCC currently performs validation checks on 40 sites selected randomly each month. The accuracy of this sample is applied to the full population to validate the accuracy of the full set of reporting points. However, this statistical method could lead to inaccurate flows being undetected for many years. One problem associated with video assessment is the possibility of manual counting errors. These could result in an accurate site being assessed as inaccurate and vice versa. Where a site is initially assessed as inaccurate, the counts can be re-checked to eliminate the errors. However, if an inaccurate site is assessed as accurate, it is unlikely to be rechecked and therefore the inaccuracy will never be detected, unless it is selected as part of a future random sample. The other major problem with the video survey validation method is that the flow data is only validated for the period of the survey (normally 2 hours) which may not be representative of the sample link flows on a day to day basis.
NTCC developed the Long-term Integration Process for detecting errors in loop-based flow data to improve the methodology for validating link flows on the project network. This applies the principles of Kirchhoff's law for electric current to vehicle flows on the Project Network and was reported in TEC [1]. The LIP methodology has now been used to develop CAVEMAN - the Continuous Assessment of Validation Equations by Monitoring the Agency's Network.
Kirchhoff's law for electric current states that:
The sum of the currents entering a node must equal the sum of the currents exiting a node.
LIP applies this law to vehicle flow rates by representing the Project Network as links joined by nodes in a series of validation sets. Additionally, analysis of traffic flows on the Project Network have shown [1] that over a seven-day period, total flows measured on a carriageway in one direction are approximately equal to flows measured on the opposite carriageway enabling opposite flows to be included in validation sets. A small number of exceptions exist (notable amongst these is the Severn Bridge, where a toll is charged to cross into Wales but not in the opposite direction). Once such a location is known and its effect quantified, it can be included in a validation set by using a correction factor in order to scale the opposite flows.
There are two standard templates which represent geometries commonly found on the Project Network. The first template is based upon the layout of a motorway grade-separated junction; the second represents the layout of a dual carriageway. These templates assist in the development of validation equations for each junction set. For example, in the motorway grade-separated junction shown in Figure 1, the flow at Link 1 is compared with the sum of those at Links 6 and 7, with the sum of the flows at Links 2 and 4 and with the flow at Link 12. If all agree within a defined limit of accuracy, then all can be regarded as accurate. If they all disagree, the flow on Link 1 is inaccurate. If one is wrong and the others are correct, the flow on Link 1 is almost certainly accurate and the inaccuracy will be in one of the other flows. All the comparisons can be verified against each other.

For dual carriageways, the number of validation equations that can be derived from a standard geometry is less than that for a grade-separated junction. This is due to the number of un-monitored roads which contribute to the flows measured on the main carriageways. In Figure 2 the flow on Link 1 can validate the flow on Link 6; Link 2 flow can validate flow measured on Link 5 and Link 3 flow can validate Link 4. Flows measured on Link 3 cannot be used directly to validate flows on Link 2 as the flows leaving and entering the main carriageway are unknown.

These principles have been used to develop the LIP validation model. This model represents the Project Network as a series of junction sets containing one or more reporting point links. Each set contains a series of validation equations that can be used to validate the flows measured on each link within the set.
The initial version of the LIP validation model was developed in 2005 [1]. Weekly analysis demonstrated that link flows can be validated where accurate and that validation exception errors can be used to identify flow inaccuracy.
Validation exception errors can be caused by:
Errors can also be raised in cases where the link flow validation equations are inaccurate.
These may occur when:
Once the inaccuracies have been identified, the causes can be investigated and faults rectified.
Regular analysis of the Project Network using the LIP process established the methodology to be accurate, enabling the detection of flow inaccuracies due to equipment faults and network modelling errors. The application of the LIP process in its initial form proved to be cumbersome and time-consuming. However, over a period of time, it did allow NTCC to identify inaccurate traffic data and take corrective action that could be verified by video surveys. For a practical day-to-day accuracy verification process, a more streamlined and automated tool was required and the CAVEMAN (Continuous Assessment of Validation Equations by Monitoring the Agency Network) process was created.
The concept of "continuous assessment" was developed to allow an automatic measure of delivered service level. Previously, the service level had been assessed on a monthly basis using video survey results and using a statistical method to apply the results to the full reporting point population. The single criterion was (and still is) that the product of the percentage of all reported data accurate to within defined levels of tolerance and the overall availability must be greater than 95%. For example, if 98% of all reported data were accurate to within the defined levels of tolerance, in order to meet the criterion, the overall availability of data must be 97%. The main disadvantages of the video survey method, apart from the cost, were that it depended on the ability of individuals to count and classify vehicles and it only considered a 2-hour snapshot within the month. The consequence of the snapshot is that a data report that is in error for a short period of time is either reported as totally bad or totally good, depending on the timing of the snapshot.
CAVEMAN has now been accepted by the HA as the prescribed method for assessing service level for traffic flow data, alleviating the need for the video survey method.
The CAVEMAN calculation and reporting system has been developed as a Microsoft Access application. This extracts traffic data for the NTCC's ORACLE database and then uses the LIP methodology to analyse and report flow accuracy.
The daily monitoring process can be summarised by the following steps:
The CAVEMAN validation equations define conditions where the net flow described by a validation calculation is zero.
The following is an example showing the derivation of a validation equation for a typical node in the project network.

The diagram shows a representation of three links joining at a single node.
If a, b and c represent the vehicle flow rate on the links, the test criteria is
The measure of the variance from the test condition is
This error calculation is used in the CAVEMAN model to calculate errors associated with unclassified (i.e. total) flows. Flow accuracy validation is also required for classified flows, where vehicles are divided into two length classifications: short vehicles less than 6.6m in length and long vehicles greater than 6.6m in length.
The Traffic Monitoring Equipment categorises the counted vehicles by length and supplies the count information in four categories. These four categories are used to identify vehicles as short (category 1+category 2) and long (category 3+ category 4).
The Caveman model uses a similar error calculation to test for the accuracy of classified flows:
Where as, bs and cs are the short vehicle flow rates, al, bl and cl are the long vehicle flow rates and aT, bT and cT are the total flow rates on each link.
The allowable deviation from the validation criteria before an exception error is raised is defined by the Highway's Agencies link categorisation. The HA has classified the different roads on the Project Network as "A", "B" or "C", according to the importance of the routes. The required accuracy is shown in Table 1 for the three categories.
The CAVEMAN validation equations are designed to test the HA acceptance criteria for each reporting point over a seven day period as this is the optimum time span for validation traffic flows using the LIP validation model [1]. However, the single day errors are also used to provide a more granular measure which can be used to monitor step changes in flows. These errors give an early indication of faults such as equipment failure or changes to the project network. The CAVEMAN criteria for raising exception errors use the acceptance limits are shown in Table 2.
This example demonstrates the application of the CAVEMAN validation process in order to test the accuracy of the link flow data on the M3 westbound between J3 and J4. This is a Category A reporting point link, identified by Link_ID 103047401in the HA Project Network.
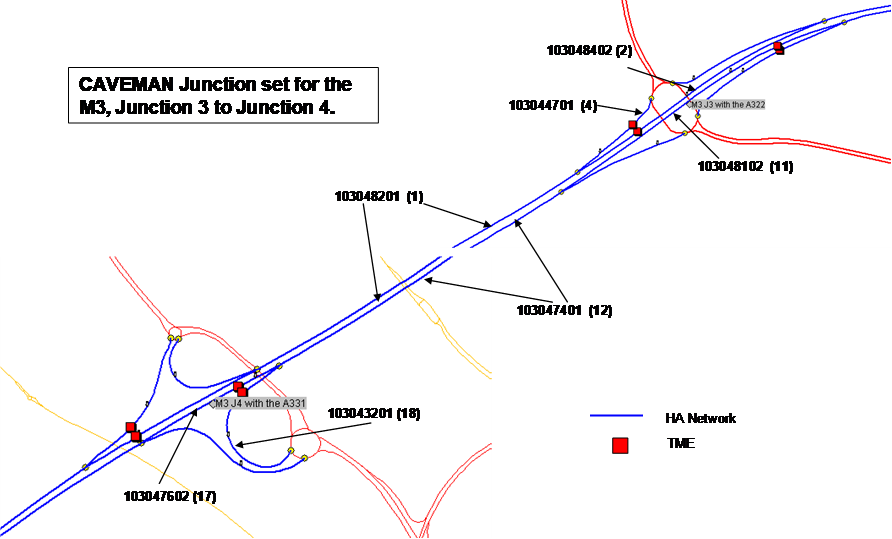
Link 103047401 is a member of the validation link set for the M3, junctions 3 to 4 as shown in Figure 3. This figure shows the Project Network link identifiers and their equivalent Link position numbers in the CAVEMAN validation template for a grade-separated junction shown in Figure 1.
There are four test calculations that can be used to validate the accuracy of link 103047401 in this set. Over a seven day period, the total flow (i.e. vehicles/hour) measured on the link will equal:
Link flows are derived from traffic counts received from Traffic Monitoring Equipment and each link has one or more flow formulae which converts traffic counts measured at equipment locations to a vehicle flow rate at a reporting point. The flow formulae for each link used in this example are shown in Table 3. Where it is possible at least two flow formulae are identified for each link, with the most accurate designated as Priority 1, the next as Priority 2, etc. In cases where there are no alternative flow formulae, Priority 1 and Priority 2 formulae are the same. A full description of the derivation of flow formulae is described elsewhere [2].
By examining the Priority 1 flow formulae for links 103047401 (12), 103043201 (17) and 103043201(18) it can be seen equipment (represented by the LMS term in the flow formulae) which supplies the traffic count data for the link ID 17 and 18 are used to derive flow data for link ID 12. The proposed test to verify the flows measured on link 103047401 using flows observed on 103043201 and 103043201 is therefore invalid as the validation equation is recursive. These recursive validation equations are identified as part of the daily CAVEMAN analysis process. The results of recursive calculations can be used to identify errors in the validation model but cannot be used to validate link flows.
The calculation output for the sample set is summarised below and simulates a scenario where a fault developed on a TMU outstation mid-way though Day 2 causes a significant reduction in flow to be observed on the link 103047401. Tables 4a and 4b show the 7-day averaged flow data and results of the unclassified error validation error calculations as a result of the equipment fault.
The minimum error used to monitor the accuracy of flow data is slow to respond to the fault, with the full affects being evident in the calculation output after 7 days. The CAVEMAN system would raise an exception report after two days.
Tables 5a and 5b show the same fault scenario using single day averaged data. In this case the CAVEMAN reporting would raise an exception after 1 day - allowing fault to be diagnosed and progressed at an earlier stage. In both cases, the error calculation results for the recursive formulae (17, 18,-12) are shown. This highlights the need to identify and exclude recursive validation formulae from the error reporting process.
Application of the CAVEMAN process to the HA Project network has demonstrated successful continuous assessment of flow accuracy on a daily basis using the LIP methodology; this has now been accepted by the HA as the prescribed method for assessing service level for traffic flow data. The process also enables the identification of equipment faults and Project Network link flow model inconsistencies and inaccurate flow formulae.
There is potential to use the LIP methodology in other traffic network applications where a suitable validation model can be derived. Examples may include the development of a model designed to validate the count data from Traffic Monitoring Equipment and the development of processes to investigate traffic behaviour in specific areas.
NTCC would like to acknowledge the support of the Highway's Agency in the development of CAVEMAN process as a method of validating the accuracy of flows on the Project Network.
[1] L D Howe Detecting Errors in Loop-Based Flow Data Using a Long-term Integration Process (LIP) TEC 48 Issue 6 (June 2007)
[2] [2] L D Howe Deriving Accurate Flow Data for Unmonitored Links TEC 49 Issue 3 (March 2008)

 Download a PDF version of this paper